What’s Included in a Detailed Report?
A Detailed Report is a great way to summarize the activity in your site in a visual way that allows you to dive into the details about your site’s performance.
The Detailed Report has 7 pages total. Here is what you will be able to find on each page.
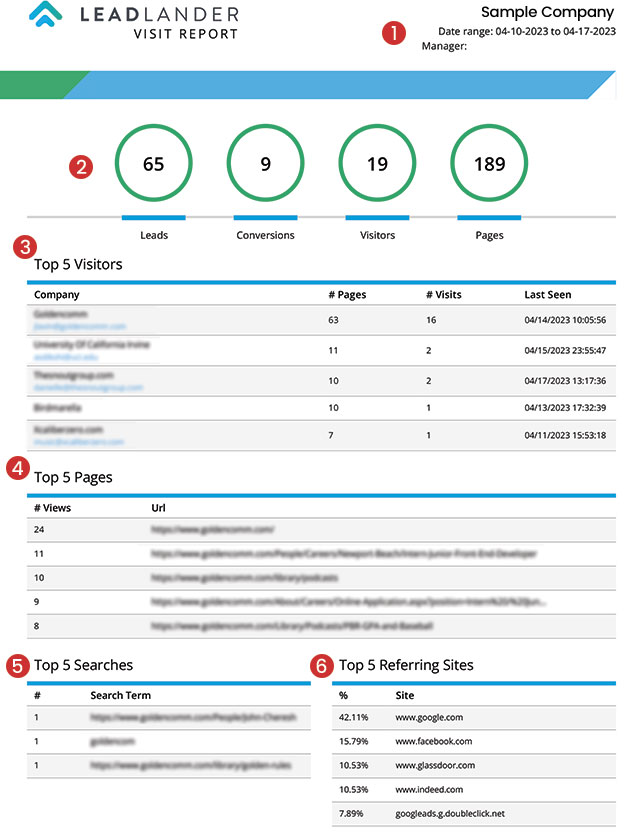
Page 1: Top 5 Visitors, Pages & More
This page is the same information found in the Summary Report.

- Report details – This section appears at the top of each page, and specifies the following information:
- The name of the Company the report was created for.
- The Date range the report covers
- The manager of the account that was used to create the report.
- Statistics Summary – This section provides a quick summary of the following statistics:
- Leads – This is the number of people who have visited your website for the period of time specified in your report.
- Conversions – This is the number of visitors that have filled out a contact form in the period of time specified in your report.
- Visitors – This is a list of the identified leads that visited your site in the period of time specified in your report.
- Pages – This is the total number of pages viewed by all visitors during the period of time specified in your report.
- Top 5 Visitors – This section lists the 5 most active visitors to your site measured by number of visits and number of pages viewed.
- Top 5 Pages – This section lists the top 5 most visited pages on your website.
- Top 5 Searches – This section lists the top five search queries that were used to find your website during the time indicated by your report.
- Top 5 Referring Sites – This section lists the top five websites that provided links used by your visitors to find your site during the time period indicated by your report. These results are ranked by the percentage of visitors that clicked on the referring link.
Page 2: Visits by Date, Hour & Day of the Week
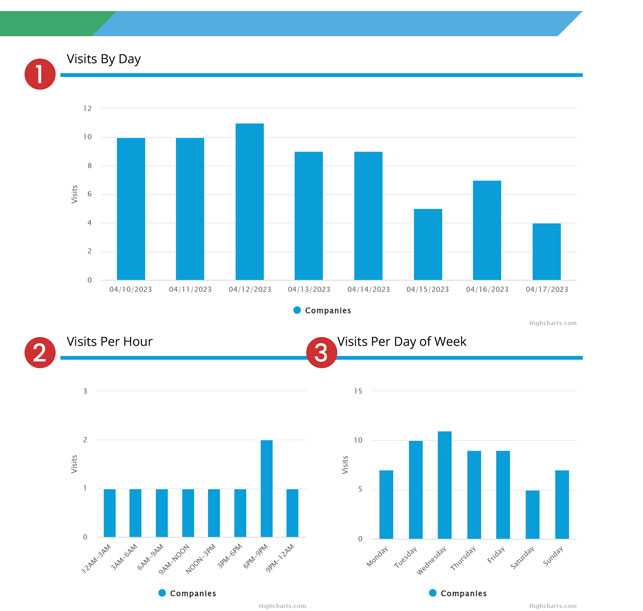
This page contains charts to help visualize the activity of your website by day, hour, and Day of the week.

- Visits By Day – This chart shows the total number of visits on each calendar day that is covered by the report.
- Visits Per Hour – This chart provides the average number of visits that occured for each 3 hour block of time throughout the day.
For example, if my report was for 3 days, and for the Noon – 3PM block I 3 visitors of the first day, 5 visitors on the second day, and 1 visitor on the third day, the chart would show an the average of 3 visits for the Noon – 3 PM block. - Visits Per Day of Week – This chart provides the average number of visits that occurred for each weekday that is covered in your report.
For example, If a report covers 14 days, you will see one entry for each day of the week, and the number represented in the chart will be the average number of visits between each weekday.
Pages 3-5: Your 20 Most Active…
These pages include more details on the following lists provided in page 1:
- Your 20 most Active Visitors (See Top 5 Visitors in Page 1)
- Your 20 most Active Pages (See Top 5 Pages in Page 1)
- Your 20 most Active Searches (See Top 5 Searches in Page 1)
- your 20 most Active Referrals (See Top 5 Referring Sites in Page 1)
Page three is a longer list of your most active visitors (See Top 5 Visitors in Page 1). Instead of just the top 5 visitors, this page will list the top 20.
Page 6: Most Recent People & Search Terms
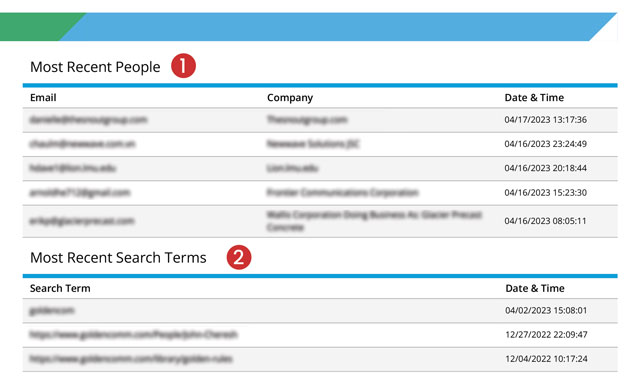
This page provides your statistics in a different way. Instead of giving you the most active information, it provides the most recent.

- Most Recent People – This is a list of the 20 most recent visitors to your website as defined by the dates covered in the report.
- Most Recent Search Terms – This is a list of the most recent Search Terms used by users that found your site through a search engine.
Page 7: Location Charts
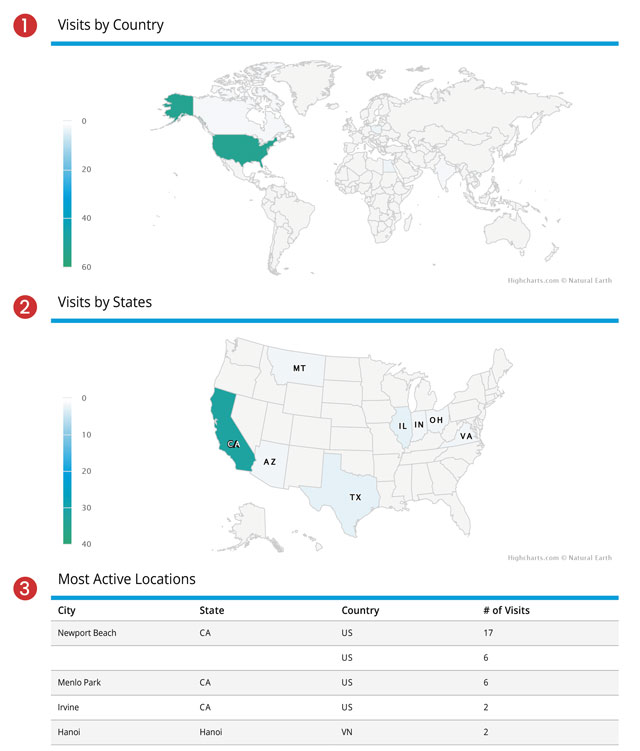
Page seven contains Geographic data about your visitors. Here you will find maps and tables letting you know where your users are from based on the IP address that was gathered when they visited your site. This information is great to know where your marketing is working, and where your sales efforts should be focused, or where you need to bolster your marketing efforts depending on your goals.

- Visits by Country – This map shows which countries your visitors are from. The concentration of visitors in each country are indicated by the color coding scale on the left of the map.
- Visits by States – This map breaks down which state in the United States your visitors are from. The concentration of visitors in each state are indicated by the color coding scale on the left of the map.
- Most Active Locations – This table provides more granular data, breaking the number of visits down to the city where your visitors are from.